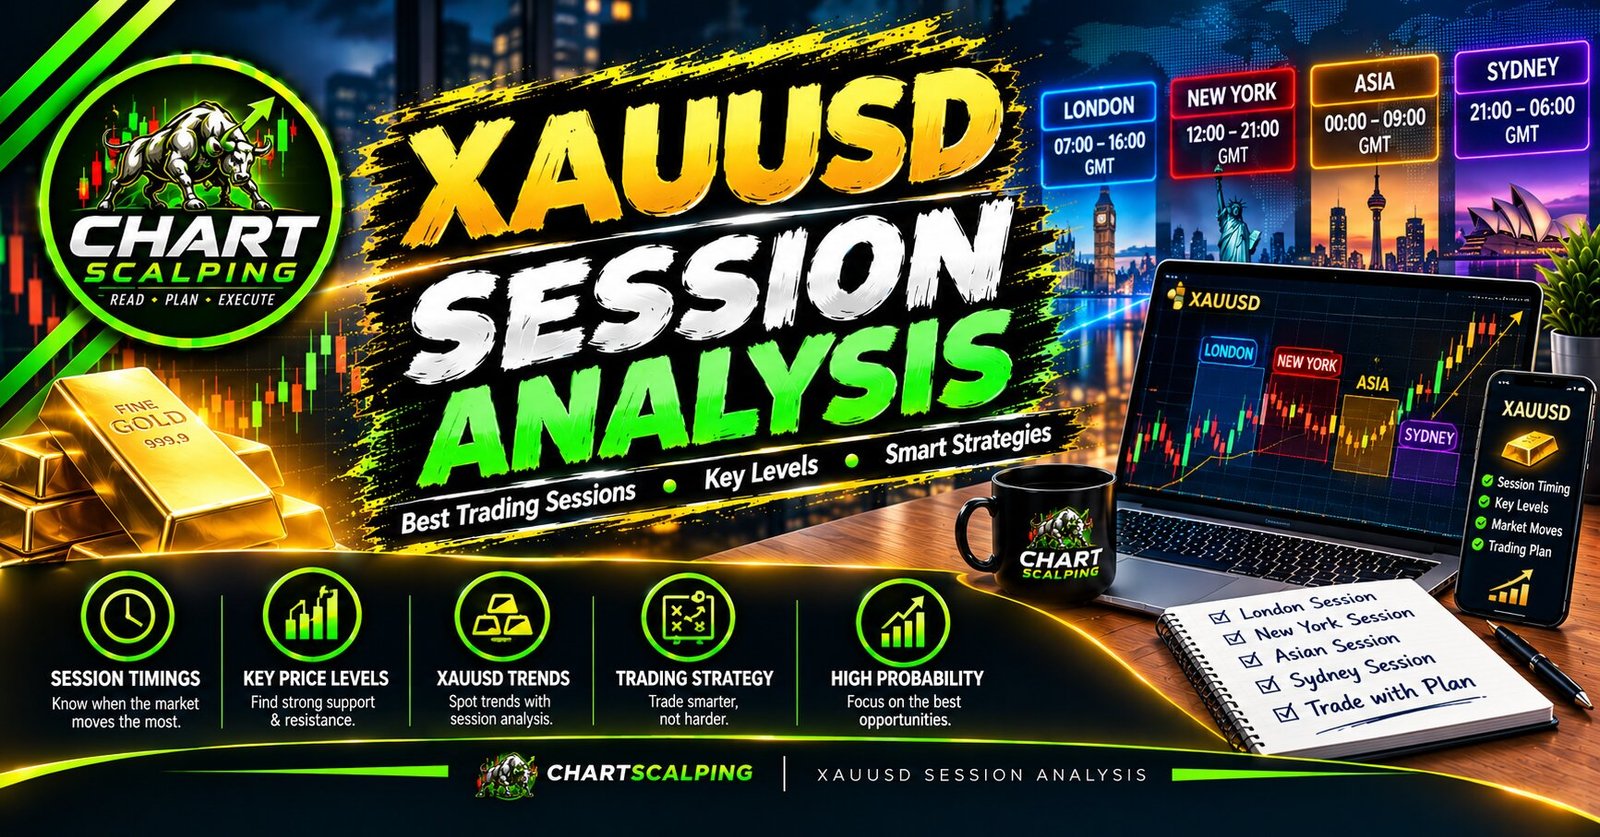
XAUUSD does not behave exactly the same way throughout the trading day. Changes in liquidity, participation, volatility and economic events can significantly affect gold's price behavior.
This is why session analysis can be an important part of a structured gold trading process.
Instead of looking at a chart as one continuous movement, traders can divide the trading day into major sessions and study how price behaves around each session's highs, lows, ranges and liquidity.
1. Why Session Analysis Matters
The forex and gold markets operate across multiple global financial centers.
As different markets become active, the amount and type of participation can change.
For XAUUSD traders, session analysis can help answer questions such as:
- When did the current range develop?
- Where are the important session highs and lows?
- Which liquidity level is price approaching?
- Is volatility expanding or contracting?
- Has the session established a clear directional structure?
- Is a major economic event approaching?
The purpose is not to predict the future simply from the clock. The purpose is to add context to price action.
2. The Three Major Trading Sessions
For practical analysis, traders commonly divide the global trading day into three major periods.
Often used to establish an early trading range.
London Session
European participation increases and price may expand beyond earlier ranges.
New York Session
U.S. participation increases and major U.S. economic events can affect volatility.
The exact behavior and volatility can vary from one day to another.
3. Asian Session
The Asian session can provide an important reference range for later trading activity.
Depending on the day and market conditions, XAUUSD may trade within a relatively contained range during quieter periods.
What to Mark
- Asian High
- Asian Low
- Asian Range Size
- Important swing points
Later sessions may interact with these levels in different ways.
4. London Session
The London Session is particularly important for forex traders because European market participation becomes active.
For XAUUSD, traders may observe increased movement around important session levels.
What to Watch
- Asian range breakout
- Sweep of Asian High
- Sweep of Asian Low
- Displacement
- Market structure shift
- Expansion toward another liquidity level
A breakout can continue, fail, or develop into a larger directional move.
5. New York Session
The New York Session introduces increased U.S. market participation.
XAUUSD can become particularly sensitive to U.S. economic data, interest-rate expectations and movements in the U.S. dollar.
What to Watch
- London session high
- London session low
- Previous day high
- Previous day low
- Major economic releases
- Continuation or reversal of London's move
6. Session Overlaps
Session overlaps occur when major financial centers are active at the same time.
The London–New York overlap is particularly important to many forex traders because both European and U.S. participation can be present.
For XAUUSD, this period may experience significant volatility, particularly when important U.S. economic data is released.
7. Building the XAUUSD Session Range
One of the simplest tools for session analysis is the session range.
For each session, mark the highest and lowest price reached during your predefined session window.
Session Low
Session Range
You can then compare the current session with the previous session.
Questions to Ask
- Is today's range expanding?
- Is price still inside the previous range?
- Has a session high been taken?
- Has a session low been taken?
- Is price accepting outside the range?
- Is the breakout being rejected?
8. XAUUSD Liquidity Levels
Session analysis becomes more useful when combined with liquidity mapping.
Important levels may include:
- Asian High
- Asian Low
- London High
- London Low
- Previous Day High
- Previous Day Low
- Equal Highs
- Equal Lows
- Major swing points
These levels provide a framework for observing where price may encounter meaningful reactions.
9. Gold Volatility by Session
XAUUSD volatility can change significantly throughout the day.
Instead of assuming that one session is always better, study actual historical data.
Measure
- Average session range
- Average M5 candle range
- Number of valid setups
- Average stop distance
- Average target distance
- Maximum adverse movement
- Maximum favorable movement
Data can reveal whether your strategy performs better during a particular session.
10. Session Market Structure
After marking session levels, analyze the structure created around them.
Bullish
Higher Highs and Higher Lows.
Bearish
Lower Highs and Lower Lows.
Range
Price continues to move between established boundaries without clear directional expansion.
Range → Liquidity → Structure → Volatility → Confirmation
11. Building a Session Bias
A session bias is a working hypothesis about the direction in which you would prefer to look for setups.
It should not become a prediction that forces you to ignore contradictory price action.
Example Bullish Context
- Higher-timeframe structure is supportive.
- Price approaches a meaningful low.
- Downside liquidity is taken.
- Strong bullish reaction appears.
- Structure shifts upward.
Example Bearish Context
- Higher-timeframe structure is bearish.
- Price approaches a meaningful high.
- Upside liquidity is taken.
- Strong bearish reaction appears.
- Structure shifts downward.
12. Session Liquidity Sweep
One of the most useful concepts in session analysis is observing what happens when price takes a previous session high or low.
Bullish Example
Price moves below an important session low, then rejects the area and begins showing bullish displacement.
Bearish Example
Price moves above an important session high, then rejects the area and begins showing bearish displacement.
13. BOS & Displacement
After a liquidity sweep, traders can look for evidence of directional change.
A Break of Structure combined with strong displacement can provide more information than the sweep alone.
This sequence can be studied across multiple timeframes.
14. FVG & Retracement
A Fair Value Gap can appear during a strong directional move.
After displacement, price may retrace toward an imbalance or nearby structure before continuing.
An FVG should be treated as a contextual area, not a standalone signal.
15. M5 XAUUSD Session Analysis
M5 can be useful for studying the relationship between session liquidity and short-term market structure.
M15 — Context
Identify important session levels and broader intraday structure.
M5 — Setup
Look for the liquidity sweep, displacement and BOS.
M1 / M3 — Refinement
A lower timeframe can be used for entry refinement if it is part of your tested trading model.
16. Bullish XAUUSD Session Model
Consider this as a study model rather than a guaranteed setup.
- Mark the Asian range.
- Mark previous-day liquidity.
- Price approaches the lower liquidity.
- London or another active session takes the low.
- Price rejects the lower area.
- Strong bullish displacement appears.
- Bullish BOS occurs.
- Price retraces toward FVG or structure.
- Entry is considered only if the complete plan is satisfied.
17. Bearish XAUUSD Session Model
The bearish model follows the opposite structure.
- Mark the Asian range.
- Mark previous-day liquidity.
- Price approaches important upper liquidity.
- Price moves above the session high.
- The breakout fails to continue.
- Strong bearish displacement appears.
- Bearish BOS occurs.
- Price retraces toward FVG or structure.
- Entry is considered only after confirmation.
18. News & Session Volatility
XAUUSD can react strongly to major economic events, particularly U.S. data and central bank developments.
Before a session begins, check for:
- CPI
- NFP
- FOMC decisions
- Federal Reserve speeches
- Employment data
- Inflation data
- Major geopolitical developments
News can create sudden expansion, reversals, spread changes and difficult execution conditions.
19. XAUUSD Session Risk Management
Session volatility should never be used as a reason to increase risk beyond your plan.
If a technical setup requires a wider stop, position size can be adjusted accordingly.
Account Balance: $10,000
Planned Risk: 0.5%
Maximum Planned Loss: $50
The monetary risk should be calculated before selecting the lot size.
Risk first. Lot size second. Entry third.
The exact position size also depends on stop distance and the contract specifications of your broker.
20. Common XAUUSD Session Analysis Mistakes
1. Assuming Every Session Will Behave the Same
Market conditions change from day to day.
2. Trading the Clock Instead of Price
A session opening is not itself an entry signal.
3. Treating Session Highs and Lows as Guaranteed Reversals
Price can break and continue beyond any session level.
4. Ignoring Higher-Timeframe Context
A short-term reaction can occur inside a much larger directional move.
5. Chasing a Large Candle
Strong displacement can create poor entry locations if price is already extended.
6. Ignoring News
Major economic releases can completely change intraday volatility.
7. Overtrading Multiple Sessions
Watching every session can encourage unnecessary trades.
8. Changing Risk During Volatility
Fast movement should not automatically lead to larger position sizes.
21. XAUUSD Session Analysis Checklist
Use this checklist before planning a session-based gold trade.
- ✓ What session am I analyzing?
- ✓ What are the current session hours?
- ✓ Where is the Asian High?
- ✓ Where is the Asian Low?
- ✓ Where is the previous-day High?
- ✓ Where is the previous-day Low?
- ✓ What is the higher-timeframe structure?
- ✓ Where is the nearest liquidity?
- ✓ Has liquidity been swept?
- ✓ Is there meaningful displacement?
- ✓ Has BOS occurred?
- ✓ Is there a valid retracement area?
- ✓ Is major news approaching?
- ✓ Where is my invalidation?
- ✓ How much money am I risking?
- ✓ Is the potential R:R acceptable?
- ✓ Am I following my tested setup?
- ✓ Am I entering because of confirmation rather than FOMO?
22. Build an XAUUSD Session Journal
A session journal can help determine which market conditions actually work for your strategy.
Record
- Date
- Session
- Instrument
- Asian High
- Asian Low
- London High
- London Low
- Previous Day High
- Previous Day Low
- Session Range
- Liquidity Sweep
- BOS
- Displacement
- FVG
- Entry
- Stop Loss
- Take Profit
- Result in R
- News Condition
- Screenshot
After collecting enough data, compare performance by session, setup type, time window and market condition.
23. XAUUSD Session Analysis Blueprint
Mark Previous Day High / Low
Mark Major Swing Levels
Check Economic Calendar
↓
ASIAN SESSION
Mark Asian High / Low
Measure Range
Observe Structure
↓
LONDON SESSION
Watch Asian Liquidity
Observe Sweep / Breakout
Wait for Confirmation
↓
NEW YORK SESSION
Mark London High / Low
Check U.S. News
Observe Continuation / Reversal
↓
EXECUTION
Liquidity → Sweep → Displacement → BOS → Retracement → Entry
↓
REVIEW
Record Trade
Record Session Conditions
Review Execution
Final Thoughts
XAUUSD session analysis is not about finding one magical trading hour.
It is about understanding how price behaves as different market participants become active throughout the day.
By marking session ranges, identifying liquidity and studying market structure, traders can create a more organized framework for analyzing gold.
The most important step is to collect data. A session that looks attractive on a chart should still be tested against historical results before becoming part of a trading plan.
Don't trade because the session is active. Trade when your tested setup appears.
XAUUSD Session Analysis — Quick Summary
- Understand the three major trading sessions.
- Mark the Asian session high and low.
- Track London session expansion.
- Mark London highs and lows before analyzing later price action.
- Mark previous-day liquidity.
- Compare current and previous session ranges.
- Identify important liquidity.
- Watch for liquidity sweeps.
- Confirm with displacement and BOS.
- Use retracement areas carefully.
- Check major economic news.
- Calculate risk before position size.
- Journal every session and setup.
- Backtest the exact rules.
Continue Your XAUUSD Education
Continue learning about gold scalping, market structure, liquidity, M5 execution, risk management and trading psychology through ChartScalping Academy.
Explore Academy